
Ecommerce KPIs: The Metrics That Actually Matter
 Jakub Neander
Nov 2, 202610 min read
Most dashboards show 40 numbers and answer none of the questions you actually have. The ecommerce KPIs that matter are the few that tell you whether you are acquiring customers profitably, converting them, and getting them to come back. This guide gives you the formulas, rough benchmarks, and the short list of seven to put on one screen.
What Are Ecommerce KPIs?
Ecommerce KPIs (key performance indicators) are the measurable numbers that show whether your online store is healthy and growing. A KPI is different from a metric: a metric is any number you can count (page views, email opens), while a KPI is a number tied to a business decision (should we spend more on ads, fix the checkout, or lift prices?).
A good KPI passes three tests:
- It changes a decision. If no result of the number would make you act differently, it is a vanity metric.
- You can influence it. "Weather in Berlin" doesn't count, however much it correlates with sales.
- It is comparable over time. Same definition, same period, so you can see a trend.
Revenue Is Four Numbers Multiplied
Before listing KPIs, it helps to see how they connect. Store revenue is traffic, times how many visitors buy, times how much each order is worth, times how often a customer orders.
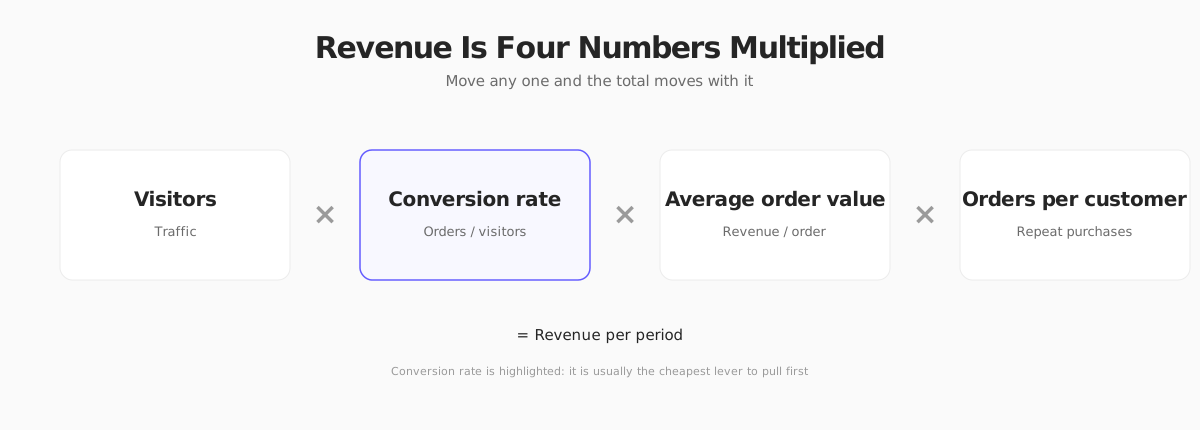
Every KPI below is a lens on one of these four levers, or on what it costs you to pull them. That is why a short list is enough: if you track one metric per lever plus cost and profit, you can see where growth is stuck.
The 7 Ecommerce KPIs That Matter Most
1. Conversion Rate
Formula: orders divided by sessions (or visitors), times 100.
This is the share of visits that end in a purchase. It is the cheapest lever to improve, because a better checkout makes every pound or dollar of ad spend work harder. Typical store-wide conversion rates sit in the low single digits, and vary a lot by category, price point and traffic source, so benchmark against your own history first and a narrow peer set second.
Segment it. A blended number hides the story: mobile versus desktop, new versus returning, paid versus organic. Mobile conversion usually trails desktop, which is why a mobile-first review of your checkout often pays off fastest.
2. Average Order Value (AOV)
Formula: revenue divided by number of orders.
AOV tells you how much each transaction is worth, and it sets the ceiling on what you can afford to spend to acquire a customer. Raise it with bundles, free-shipping thresholds set slightly above your current average, and relevant add-ons at checkout. Watch it against conversion: a threshold that pushes AOV up but pushes conversion down by more is a bad trade.
3. Customer Acquisition Cost (CAC)
Formula: total sales and marketing spend divided by new customers acquired.
Include everything that was needed to win the customer: ad spend, agency or freelancer fees, influencer product costs, tools. Use "blended CAC" (all spend over all new customers) as your baseline and "paid CAC" (ad spend over customers from ads) to judge channels. Don't mix returning customers into the denominator, or CAC looks better than it is.
4. Customer Lifetime Value (LTV or CLV)
Formula (simple): average order value × orders per customer per year × expected years as a customer × gross margin.
LTV is how much profit a customer brings over their relationship with you. Using revenue instead of gross margin is the classic mistake: it makes every channel look better than it is. For a young store without years of history, calculate it on a fixed window, such as the first 12 months, and update as data accrues.
Pair LTV with CAC. A common rule of thumb is an LTV:CAC ratio of about 3:1 or better, with payback of CAC inside 12 months. Treat it as a rough guide, not a law: cash-constrained stores need faster payback, and high-margin subscription stores can run on longer ones.
5. Repeat Purchase Rate
Formula: customers with 2 or more orders divided by total customers, over a fixed period.
Repeat rate is the best early signal of product-market fit in ecommerce. If most first-time buyers never come back, your ad spend is buying one-off sales. Track the cohort view too: of the customers who first bought in March, what share ordered again within 30, 90 and 180 days? Email and post-purchase flows move this number, and our guide to abandoned cart emails and email marketing for ecommerce cover the main plays.
6. Cart Abandonment Rate
Formula: 1 minus (completed purchases divided by carts created), times 100.
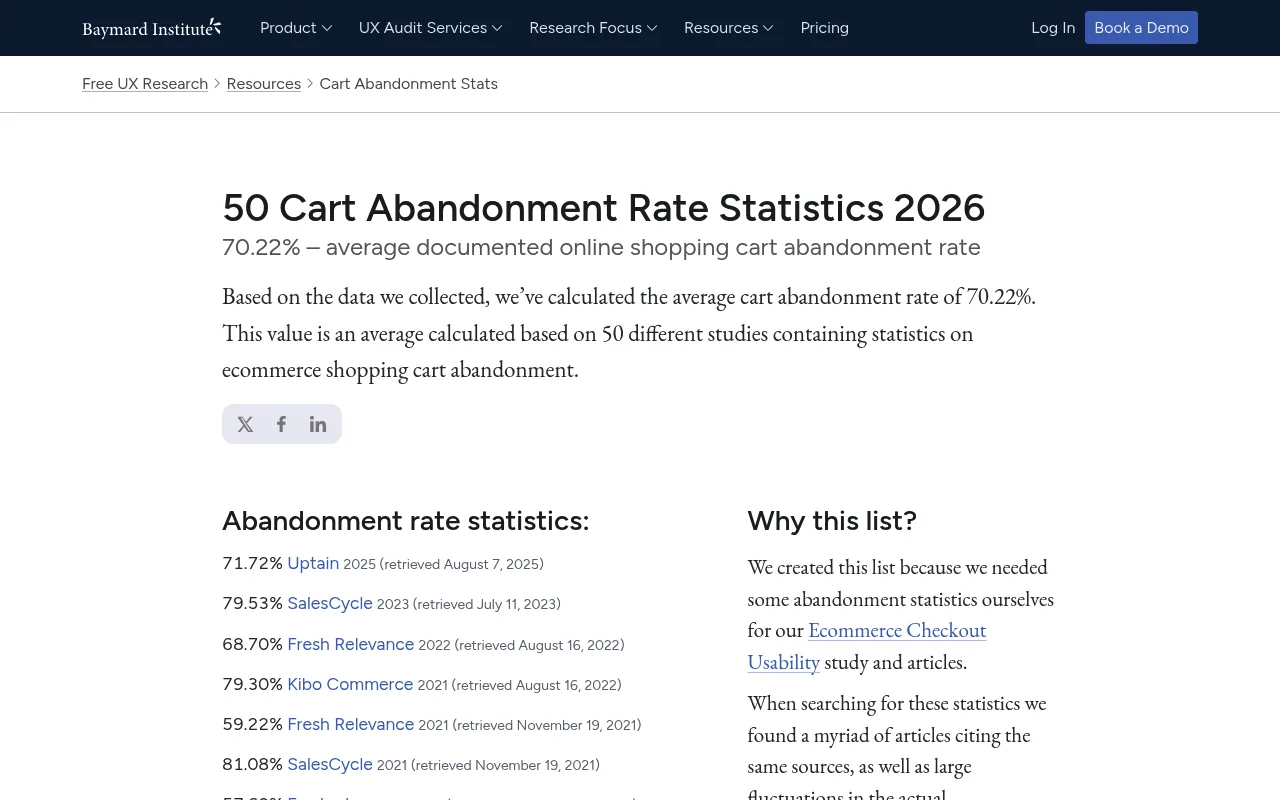
Baymard Institute's running average of published studies is about 70 percent, so a high number alone isn't alarming. What matters is the trend and where in checkout people leave. Common causes are unexpected shipping or tax costs at the last step, forced account creation, and too few payment options. Our guide on how to reduce cart abandonment goes through the fixes.
7. Gross Margin and Contribution Margin
Formula: (revenue minus cost of goods sold) divided by revenue. Contribution margin also subtracts shipping, payment fees, returns and variable marketing.
Revenue KPIs lie when margins are thin. A store can grow 50 percent and lose more money every month. Contribution margin per order is the number that tells you what is left to pay for rent, salaries and profit once the variable costs of each order are covered. Do the arithmetic per product, per channel and per country, because your shipping and returns costs differ.
KPIs by Stage: What to Watch When
| Stage | Watch first | Why |
|---|---|---|
| Pre-launch / first 100 orders | Conversion rate, cart abandonment, AOV | You need to know the funnel works before buying traffic |
| Early growth | CAC, contribution margin, repeat purchase rate | Profitable acquisition is the constraint |
| Scaling | LTV:CAC, payback period, return rate, inventory turnover | Cash and margin tell you how fast you can grow |
| Mature | Cohort retention, customer concentration, net profit | Efficiency matters more than top-line growth |
Supporting Metrics Worth a Look
You don't need these on your main dashboard, but check them monthly:
- Return rate: returns divided by orders. High returns eat contribution margin silently. Track by product and size.
- Traffic by source: share of sessions from organic, paid, email, social and direct. A store that depends on one channel is fragile.
- Email revenue share: the portion of revenue attributed to email and SMS. For many stores this is the highest-margin channel.
- Site speed and uptime: slow pages depress conversion. See our guide to ecommerce website speed optimization.
- Customer support tickets per 100 orders: a rising number points to a confusing product page, shipping delays or a policy problem.
- Inventory turnover and stockout rate: dead stock ties up cash, and stockouts lose sales you already paid to attract.
Where to Measure Them
You don't need an enterprise stack. A reasonable setup for a small store:
- Your commerce platform's reports for orders, revenue, AOV, returns and repeat customers. These come straight from the order data, so they are the most reliable.
- A web analytics tool for sessions, sources, funnels and conversion by device. Google Analytics is the default choice; PostHog is popular with technical teams that want funnels, session replay and feature flags in one place.
- A spreadsheet for CAC, LTV and contribution margin. These mix data from ads, platform and finance, so a simple sheet updated monthly beats a fragile integration.

A word on privacy: if you sell to the EU or UK, analytics cookies generally need consent, and numbers from consenting visitors only will undercount traffic and overstate conversion. Trust orders from your platform over sessions from your analytics tool when they disagree.
Common Mistakes With Ecommerce KPIs
- Tracking too many. Choose seven. Put them on one page. Review weekly.
- Looking at averages only. An AOV of $60 can hide a $20 segment and a $200 segment that need different treatment.
- Mixing revenue and profit. Optimize for contribution margin, not revenue.
- Ignoring cohorts. Blended repeat rate rises when you stop acquiring new customers, which is not good news.
- Changing definitions. If "conversion rate" meant sessions last quarter and users this quarter, the trend is meaningless.
- Chasing benchmarks. Industry averages are mixed samples. Your own trend is the benchmark that matters.
Ecommerce KPIs on Your Next Store
Your Next Store gives you the order, customer and product data that most of these KPIs start from in the admin dashboard, with advanced analytics on the Growth plan and above. The storefront is a standard Next.js app, so you can also add Google Analytics, PostHog or any other analytics tool the usual way.

We would rather be straight about the limits: YNS reports on what happens in your store, but CAC and LTV need your ad spend and margin data, so you will still keep a spreadsheet for those. See the pricing page for plan details.
FAQ
What are the most important ecommerce KPIs?
Seven cover most needs: conversion rate, average order value, customer acquisition cost, customer lifetime value, repeat purchase rate, cart abandonment rate, and contribution margin. Together they show whether you can acquire customers profitably and keep them.
What is a good ecommerce conversion rate?
It varies by industry, price point, device and traffic source, and published averages differ widely. Many stores sit in the low single digits. Measure your own baseline by segment and aim to improve it, rather than chasing a headline number.
How often should I review ecommerce KPIs?
Weekly for conversion, AOV, CAC and abandonment, so you can react to problems. Monthly for LTV, repeat rate and margin, which move more slowly and need enough data to be meaningful.
What is the difference between a KPI and a metric?
A metric is any measurement. A KPI is a metric that is tied to a goal and that changes a decision. Page views are a metric; conversion rate is a KPI.
Related Blog Posts

Before you spend more on ads,
check your store.
Get a free 25-point checklist to find what could be holding back your sales, from product pages to checkout.