# Ecommerce Analytics: How to Turn Sales Data Into Decisions
Ecommerce analytics without the noise: which tools to use, the five reports that matter and a weekly routine that turns sales data into decisions.
*Published 2026-11-12*
**Most online stores do not have a data problem. They have a decision problem.** There are dashboards in the store admin, in Google Analytics, in Meta Ads Manager, in Stripe and in the email tool, and they all disagree a little. Good ecommerce analytics is not about collecting more of it. It is about knowing which source to trust for which question, running a handful of reports that actually change what you do, and looking at them on a schedule. This guide shows how to set that up for a small or growing store, and how to go from "revenue is down" to "here is what we change on Monday".
## What Is Ecommerce Analytics?
Ecommerce analytics is the practice of collecting data about your store's visitors, orders, customers and marketing, and using it to make decisions: what to stock, what to fix, where to spend and whom to win back.
It is related to, but not the same as, tracking KPIs. [Ecommerce KPIs](/blog/ecommerce-kpis) are the handful of numbers that tell you whether the business is healthy: conversion rate, average order value, customer acquisition cost, lifetime value. Analytics is the work of explaining why those numbers moved and what to do about it. A KPI tells you conversion fell from 2.4% to 1.9%. Analytics tells you it fell only on mobile, only on product pages, and only since the new gallery shipped.
It helps to think in four levels of question:
| Level | Question | Example |
|-------|----------|---------|
| **Descriptive** | What happened? | Revenue fell 12% last week |
| **Diagnostic** | Why did it happen? | Paid social traffic halved after a campaign ended |
| **Predictive** | What is likely to happen? | At this sell-through, the bestseller runs out in 19 days |
| **Prescriptive** | What should we do? | Reorder now and move budget from paused social to search |
Most small stores live at the first level. The goal of this guide is to get you comfortably to the second and fourth.
## The Four Sources of Ecommerce Data
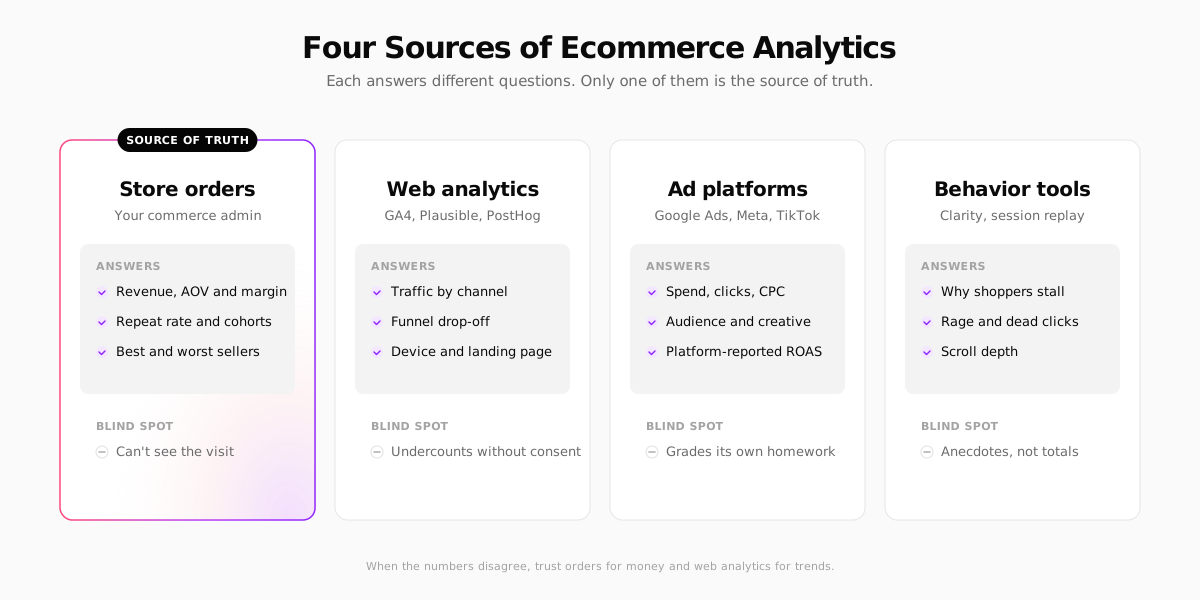
Every store's analytics comes from the same four places. Each answers different questions well, and each has a blind spot.
### 1. Your store's order data
Orders, line items, refunds, customers and product costs, straight from your commerce platform. This is the **source of truth for money**: it is not affected by ad blockers, cookie banners or tracking bugs. If your web analytics says 140 purchases and your store says 152, the store is right.
Its blind spot is the visit: on its own, an order does not tell you how the shopper found you or what they looked at first, unless your platform also records traffic and attribution.
### 2. Web analytics
[Google Analytics 4](https://marketingplatform.google.com/about/analytics/) is the free default. It tracks sessions, traffic sources, landing pages and, if you send the [recommended ecommerce events](https://developers.google.com/analytics/devguides/collection/ga4/ecommerce), the full shopping funnel from `view_item` to `add_to_cart`, `begin_checkout` and `purchase`.

Privacy-first alternatives such as [Plausible](https://plausible.io/) count visits without cookies and are simpler to read, at the cost of GA4's depth. Product analytics tools like [PostHog](https://posthog.com/product-analytics) add funnels, retention curves, paths and session replays in one place, which suits technical teams.


The blind spot: in the EU and UK, cookie-based analytics only sees visitors who consent. Traffic is undercounted, and since buyers are more likely to have accepted cookies than bouncers, conversion rate can look higher than it really is.
### 3. Ad platforms
Google Ads, Meta, TikTok and the rest report spend, clicks and the conversions they believe they caused. That data is essential for managing campaigns and comparing creatives. It is also self-reported: each platform credits itself for any sale it touched within its attribution window, so the platforms' conversions added together usually exceed your real orders. Treat platform ROAS as a relative signal between campaigns on the same platform, not as a number to add up.
### 4. Behavior tools
Heatmaps and session recordings show what shoppers actually do on a page: where they tap, how far they scroll, where they rage-click on something that is not a button. [Microsoft Clarity](https://clarity.microsoft.com/) does this for free.

Recordings are anecdotes, not statistics. Use them to explain a drop you already found in the numbers, not to find the drop in the first place.
**When the numbers disagree, use this rule:** trust your store's orders for money, web analytics for trends and journeys, ad platforms for comparing campaigns with each other, and recordings for the "why". Don't try to make them reconcile to the last order. They measure different things.
## Setting Up Ecommerce Analytics Properly
A tidy setup is worth more than a clever report. Before you analyze anything, check these.
### Track the funnel events
At a minimum, your web analytics should receive product views, add-to-cart, checkout started and purchase, each with value, currency and product IDs. Without them, you cannot build a funnel or a product report. Fire each event once: duplicated tags (a hard-coded GA4 snippet plus the same tag in Google Tag Manager) are the most common reason purchase counts look inflated.
### Tag your campaigns
Add UTM parameters (`utm_source`, `utm_medium`, `utm_campaign`) to every link you control: emails, influencer links, social bios, QR codes. Untagged traffic lands in "direct" or "referral" and makes your best channels look worse. Agree on one naming convention (lowercase, no spaces) and write it down.
### Fix data retention
GA4 standard properties can keep user-level data for [2 or 14 months](https://support.google.com/analytics/answer/7667196). If yours is set to 2, your explorations, including cohort and funnel reports, cannot look back further than that. Set it to 14 months on day one.
### Handle consent
In the EU and UK, analytics cookies generally need consent. Use a consent banner that actually blocks tags until the visitor agrees, and, if you use Google's tools, [consent mode](https://developers.google.com/tag-platform/security/concepts/consent-mode) so tags adjust to the visitor's choice. Our guide to [cookie consent for ecommerce](/blog/cookie-consent-ecommerce) covers the banner side, and the guide to [GDPR for ecommerce](/blog/gdpr-ecommerce) covers the rest.
**Always check the current rules where you sell.** This section summarizes EU and UK consent expectations for analytics as of November 2026. National regulators interpret the rules differently and guidance changes, so confirm your setup with your data protection authority or a privacy specialist. This is general information, not legal advice.
### Record product costs
Revenue reports are easy; profit reports need the cost of each product. Enter landed costs (product, inbound shipping, duties) in your platform. Without them, you will optimize for bestsellers that quietly lose money.
## The Five Ecommerce Analytics Reports That Drive Decisions
You can build hundreds of reports. These five answer most of the questions a store owner actually has.
### 1. The conversion funnel
Sessions → product views → add to cart → checkout started → purchase, split by device. The biggest percentage drop is your highest-value fix.
**Decisions it drives:**
- Big drop from product view to cart: look at price, photos, delivery information and reviews on the product page. Our [product page design guide](/blog/product-page-design) lists what to check.
- Big drop from cart to checkout: unexpected shipping cost is the usual suspect.
- Big drop inside checkout: forms, payment methods and errors. See [how to reduce cart abandonment](/blog/how-to-reduce-cart-abandonment).
- Mobile much worse than desktop at one step: something is broken or awkward on small screens. Watch ten recordings of that step.
### 2. Channel performance
Revenue, orders, new customers and conversion rate by traffic source, next to what you spend on each. This is where you compare paid search, paid social, organic search, email and referrals on equal terms.
**Decisions it drives:** where the next dollar of budget goes, and which channel to cut. Look at new customers, not just revenue: email always looks brilliant because it sells to people you already acquired elsewhere.
On attribution: last-click models over-credit the final touch (often branded search or email), and platform models over-credit themselves. A practical compromise for a small store is to compare first-touch and last-touch views side by side, and to run the occasional holdout, such as pausing a channel in one region for two weeks, when a big budget decision depends on it.
### 3. Product performance
For each product: views, add-to-cart rate, units sold, revenue, gross profit and return rate.
| Pattern | What it usually means | What to do |
|---------|------------------------|------------|
| High views, low add-to-cart | Page or price problem | Check photos, price, delivery info; watch recordings |
| High add-to-cart, low purchases | Shipping cost or stock issue | Check total cost at checkout and availability |
| High sales, low margin | Underpriced or expensive to ship | Raise price, bundle, or change packaging |
| High return rate | Expectation mismatch | Improve sizing info and photos |
| Low views, high conversion | Hidden gem | Feature it in navigation, email and ads |
### 4. Cohort retention
Group customers by the month of their first order and track what share buys again in each following month. It is the clearest view of whether your store keeps customers or keeps replacing them.
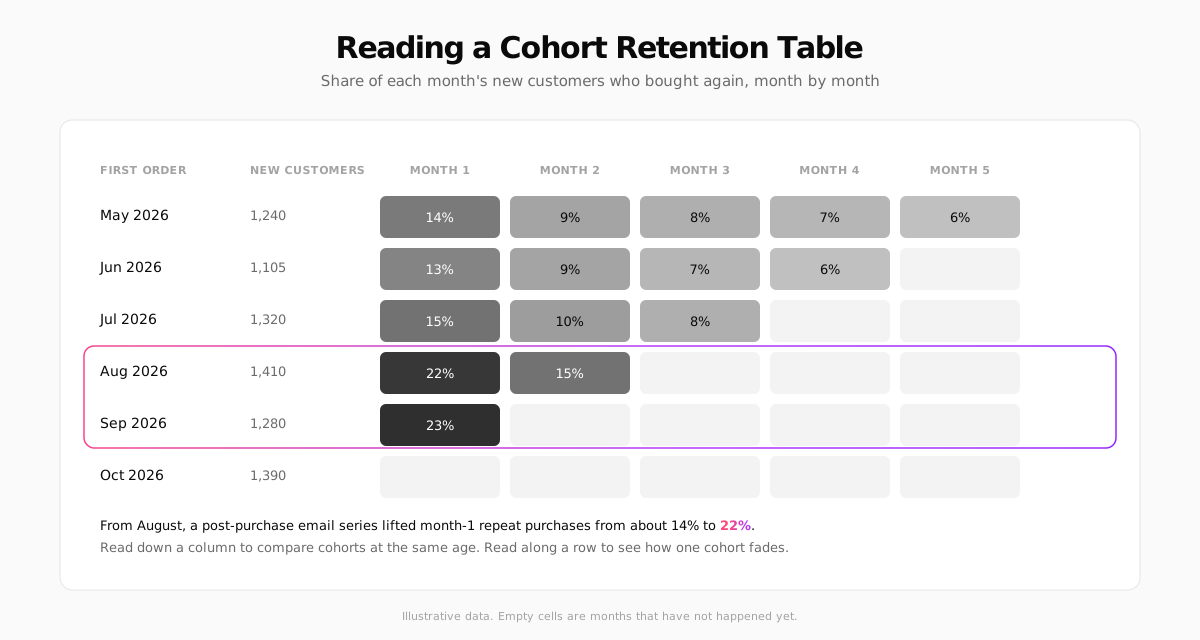
Read down a column to compare cohorts at the same age: if newer cohorts retain better, something you changed is working. Read along a row to see how fast one cohort fades. A cohort table is also the honest way to judge retention work such as [post-purchase emails](/blog/ecommerce-email-marketing) or a loyalty offer, because blended repeat rate rises on its own whenever you stop acquiring new customers.
**Decisions it drives:** how much you can afford to pay to acquire a customer, whether retention work is paying off, and which acquisition months (and therefore which campaigns) brought in customers who stay.
### 5. Customer segments (RFM)
RFM scores each customer by **recency** (how long since the last order), **frequency** (how many orders) and **monetary value** (how much they spent). You do not need special software: export customers with last order date, order count and total spend, and sort.
Four segments cover most of the value:
- **Champions:** bought recently, often, and spend a lot. Thank them, give early access, ask for reviews.
- **Promising newcomers:** one recent order. The second order is the hardest; a well-timed follow-up email matters most here.
- **At risk:** used to buy often, but not for a while. Win-back offers belong here, not in a blanket discount to everyone.
- **Lost:** one order long ago. Cheap to keep on the newsletter, expensive to chase.
## A Weekly Ecommerce Analytics Routine
Reports change nothing unless someone looks at them on a schedule and writes down a decision. A routine that takes about 30 minutes a week:
1. **Headline numbers (5 minutes).** Revenue, orders, AOV, conversion rate and new customers versus last week and the same week last year. Note anything that moved more than about 10%.
2. **Explain the biggest move (10 minutes).** Use the funnel and channel reports to find where it came from: one channel, one device, one product, one step.
3. **Check products and stock (5 minutes).** Bestsellers running low, products with views but no sales, refunds rising.
4. **Decide (5 minutes).** Write down one to three actions with an owner, and what you expect each to change.
5. **Close last week's loop (5 minutes).** Did last week's actions move the number you expected?
Once a month, add the slower reports: cohorts, RFM segments, margin by product and channel. Once a quarter, review the setup itself: event tracking, UTM hygiene, consent rates.
**Keep a decision log.** A shared document with the date, what you saw, what you changed and what happened next. After three months, it is the most useful analytics asset you own, and it stops the same debate from happening every quarter.
## Dashboards: Build One Page, Not Ten
If your platform's built-in dashboard covers your weekly numbers, use it. If you need to combine sources, Google's free [Data Studio](https://cloud.google.com/blog/products/data-analytics/looker-studio-is-data-studio) (called Looker Studio until its rename in April 2026) connects to GA4, Google Ads, Google Sheets and many other sources.

A good ecommerce dashboard fits on one screen and is ordered the way you read it: headline numbers at the top, the funnel below, then channels, then products. Everything on it should be something you would act on. If a chart has not changed a decision in two months, remove it.
## Common Ecommerce Analytics Mistakes
- **Reading percentages without the counts.** "Conversion up 40%" on 25 orders is noise.
- **Comparing the wrong periods.** Compare a week with the previous week and with the same week last year. Black Friday week against an ordinary week tells you nothing.
- **Trusting one attribution model.** Every model is a set of assumptions. Look at two.
- **Optimizing revenue instead of profit.** A channel that brings discount hunters can grow revenue while shrinking margin.
- **Ignoring consent effects.** If your consent rate changes, your analytics traffic changes with it, even when real traffic did not.
- **Analysis without a decision.** If a report cannot change what you do, stop producing it.
- **Calling a before-and-after a result.** For changes big enough to matter, an [A/B test](/blog/ecommerce-ab-testing) is the only way to separate your change from everything else that happened that week.
## Ecommerce Analytics on Your Next Store
[Your Next Store](https://yournextstore.com/) has an Analytics dashboard in the admin that you assemble from widgets, so the weekly routine above can live on one page. The [help center article on analytics](/help/orders/analytics) describes each widget in detail.

What it covers:
- **Sales and profit:** revenue (net or gross), orders, AOV, a sales breakdown from gross to net, refunds and gross profit once you enter product costs.
- **Customers:** new versus returning customers, repeat purchases and a cohort retention heatmap covering the last 12 months.
- **Products and operations:** top products with profit per product, most viewed products, stock health and fulfillment time.
- **Funnel and channels:** a conversion funnel with cart and checkout abandonment, conversion over time, and traffic and sales by channel. Attribution records both how a visitor first found you and what brought them back on the visit that converted.
- **Privacy-friendly traffic counts:** storefront visits are counted without cookies, and visitors with Do Not Track are not counted at all.
Some traffic widgets depend on your plan (see [pricing](https://yournextstore.com/pricing)). The limits are worth knowing too: cohorts only follow customers with an account, so guest-heavy stores should read retention as a floor, and the dashboard reports your store, not your ad spend, so CAC and blended ROAS still need ad platform data. For that, the [tracking add-ons](/help/integrations/tracking-and-pixels) connect Google Tag Manager (and GA4 through it), the Meta Pixel and the TikTok Pixel. Meta, and TikTok once you add an access token, also receive funnel and purchase events from your store's server, so they see conversions that ad blockers would otherwise hide.
## FAQ
### What is the best ecommerce analytics tool?
There is no single best tool, because no single tool sees everything. Most small stores do well with their platform's built-in reports for orders and profit, GA4 or a privacy-first alternative for traffic, Microsoft Clarity for recordings, and a spreadsheet or Data Studio report to combine them.
### What should I track first in ecommerce analytics?
Start with the purchase funnel (product view, add to cart, checkout, purchase) by device, revenue and orders by channel, and gross profit by product. Those three reports explain most changes in revenue and point to the fix.
### How often should I review ecommerce analytics?
Weekly for headline numbers, the funnel, channels and stock. Monthly for cohorts, customer segments and margin. Quarterly for the tracking setup itself.
### Why don't my Google Analytics numbers match my store's orders?
Ad blockers, declined cookie consent, duplicate or missing tags and different attribution rules all create gaps. Your store's order data is the source of truth for revenue; use web analytics for trends, journeys and sources.
## The Bottom Line
Ecommerce analytics pays off when every report ends in a decision. Pick a source of truth for each question, track the funnel cleanly, run five reports, and look at them every week with a notebook open. The stores that win on data are rarely the ones with the most dashboards. They are the ones that changed something last Monday and checked whether it worked.
## Related Blog Posts
- [Ecommerce KPIs: The Metrics That Actually Matter](/blog/ecommerce-kpis)
- [Ecommerce A/B Testing: What to Test and How](/blog/ecommerce-ab-testing)
- [How to Reduce Cart Abandonment](/blog/how-to-reduce-cart-abandonment)
- [Cookie Consent for Ecommerce: An EU-Compliant Banner](/blog/cookie-consent-ecommerce)